How to Plan, Make and Promote an Infographic
Content marketing is an investment strategy where you want to generate more future revenue than the cost to create the content. One of the best long-term investments is an infographic—information graphic that presents complex data in an easy-to-understand format using images and charts with minimal text. Since it can become a viral sensation for years, the graphic can provide a high ROI (return on investment) for your organization.
That sounds great, but they can be expensive to make… unless you have a planning process, creation process and promotion strategy like you’ll learn in this training article.
First, let’s justify your investment with 7 benefits of infographics:
—Article continues after infographic—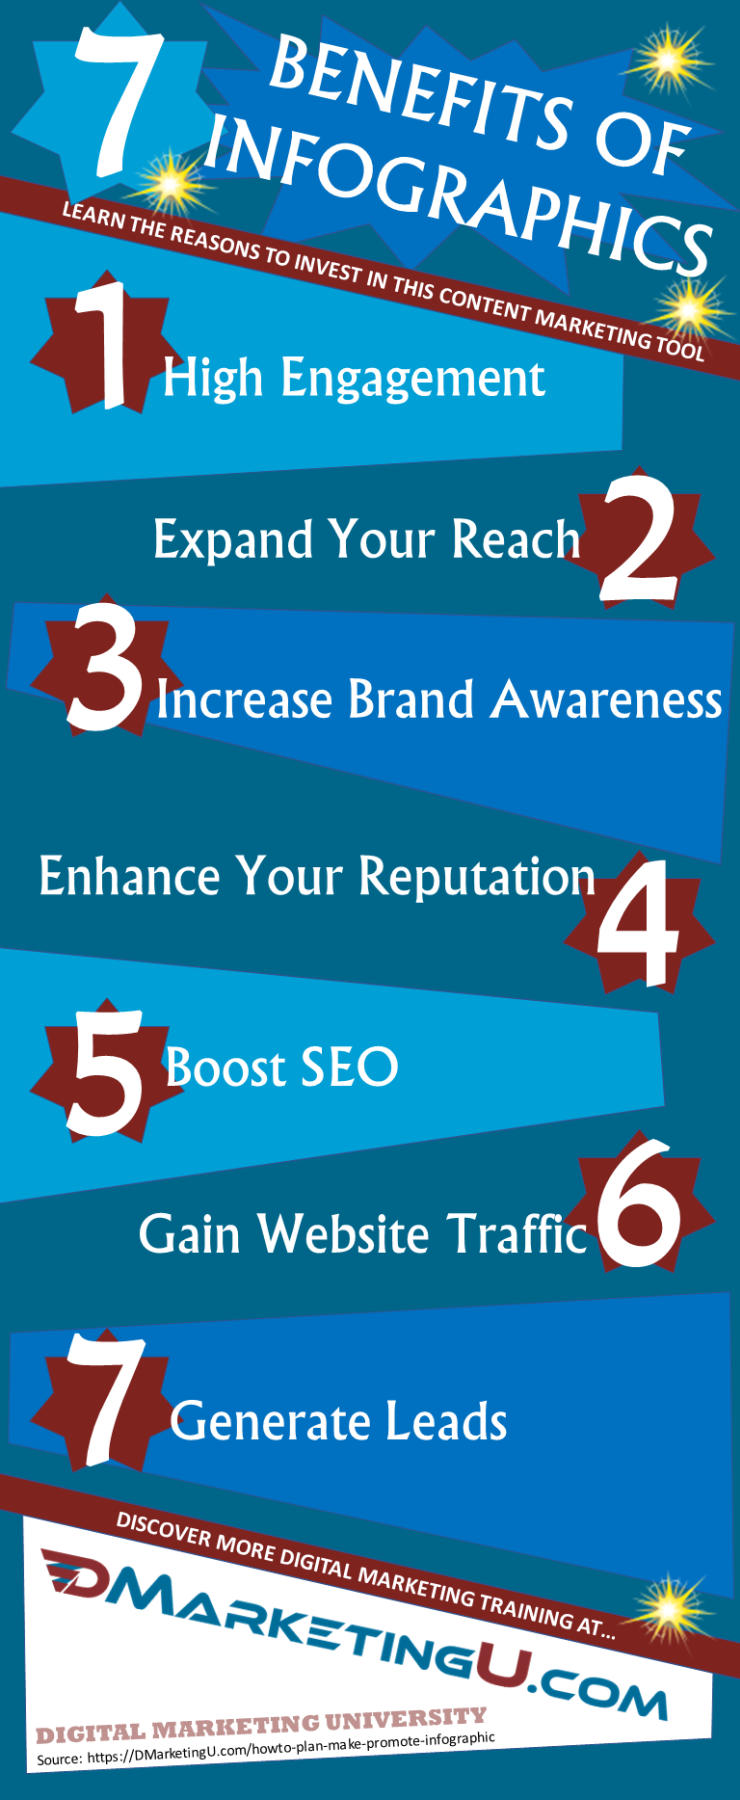
Embed code to share image on your site
- High Engagement — Your audience will love the visual storytelling, leading to more engagement.
- Expand Your Reach — Images are fun and simple to share on social media by users, helping you grow your reach to new audiences.
- Increase Brand Awareness — The shared graphic with your logo will reach more people, resulting in greater awareness of your brand.
- Enhance Your Reputation — The high-quality graphic and visual storytelling will create a positive impression with readers, assisting you to build your reputation as an expert and thought leader.
- Boost SEO — Bloggers often share infographics with a backlink to the creator’s website, improving your SEO ranking.
- Gain Website Traffic — The infographic should be hosted on a blog post or web page, triggering search engines to send visitors to your website to view the graphic.
- Generate Leads — The infographic should contain a call-to-action (CTA) such as a landing page URL, producing an opportunity to capture a new sales lead.
With a clear understanding of their potential gains, next we’ll cover some basic infographic terminology.
- Data Points & Key Takeaways: Each piece of information using data that you want to display as a graphic is a data points. To briefly explain the data point, you can include some key takeaway text with a lesson to learn in your story.
- Header & Footer: The header is the critical area at the top of the infographic with your title and optional subtitle to explain the content and start your storytelling. The footer is at the bottom of the infographic where you can list your data sources, include your logo and add an optional call-to-action (CTA), such as a link to get more information on your website.
- Hierarchy: Your data points should tell a story and that story should be organized in a hierarchy, or logical order, that will make sense to the reader.
- Orientation: Since most web pages that host images are vertical, the orientation, or direction, of your layout should be vertical as well. If it benefits your users or the data, you could consider a horizontal orientation.
- Revisions: Whether you’re designing your infographic internally or outsourcing the project, the first version is rarely perfect. Based on feedback from the key decision makers involved in the project, change requests should be batched and sent to the graphic designer to make a revision. It’s likely that you’ll need at least three (3) revisions, and probably more for longer infographics with many data points.
Now that you know the benefits and terms, let’s get started with how to plan, make and promote an infographic!
I. INFOGRAPHIC PLANNING PROCESS
In my experience, the starting point of an infographic project will occur with one of these common scenarios:
- You have complex data that you’d like to present in an easily understood manner.
- You have a process or series of steps that you’d like to illustrate.
- You want to visualize a complex topic in an easily understood manner.
- You want to compare or contrast two or more topics.
- You want an infographic as a marketing asset and need to determine what information would be popular with your target audience.
In all of these scenarios, my recommendation is to start the planning process with an analysis of your audience, then you’ll determine your marketing goal(s), then the get started with gathering the data or information. Here are the recommended Planning Process steps:
Step 1. Identify a target audience
One of the best questions to ask at the start of developing any content is, “Who is my target audience that I want to reach?” The shotgun approach of trying to appeal to everyone isn’t efficient at generating leads or meeting your marketing goals, so target your efforts on an audience segment or a “buyer persona“.
To build on the first question, the second one should be, “What stage is this audience at on their customer journey?” That means, are they aware they need a solution (top of the sales funnel), are they actively searching for a solution (middle of the sales funnel), or have they narrowed their search to a few finalists (bottom of the sales funnel)?
By determining who you’re targeting and recognizing what sales stage they’re at, your infographic can be customized to meet this audience’s needs and be more effective.
Step 2. Determine the marketing goal
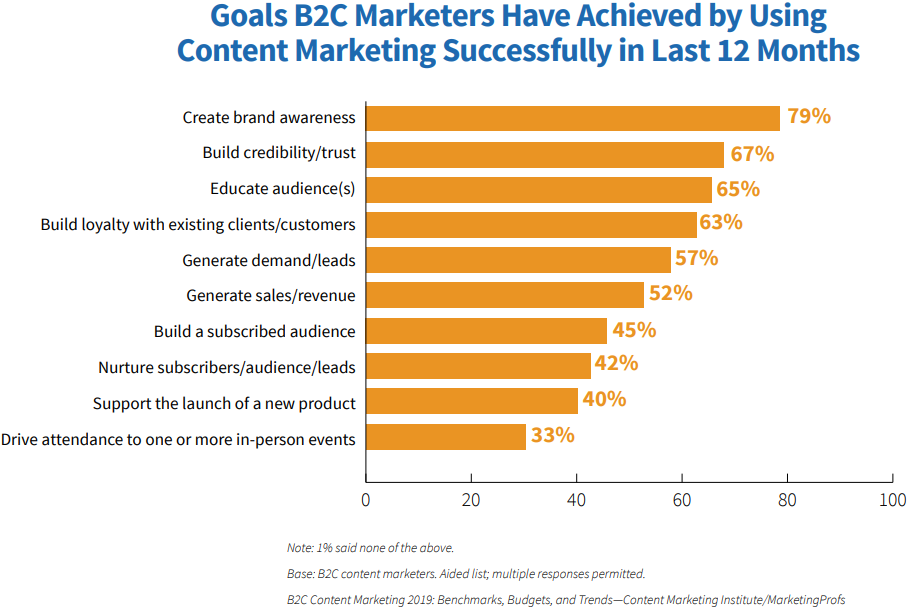
Before the creation process begins, you must know what you want to achieve with your content marketing investment. Declare a marketing goal by choosing from the popular list identified by the Content Marketing Institute’s “Goals B2C Marketers Have Achieved Using Content Marketing” or write a customized goal for the infographic based on what you want people to do with the information that you provide.
If you want to learn more about how to create a content marketing strategy that contains Goals, Objectives, Strategies and Tactics, take our FREE 12-day challenge to build a better content marketing plan.
Step 3. Determine the content based on your target audiences’ needs
Based on where you identified your audience is in their customer journey and the next action that you want them to take, ask yourself, “What does the audience need to know in this stage?” Document your audience’s needs for data, training, features & benefits, comparisons, guidance, support, survey results, or pricing.
Typically, infographics help at the top of a funnel to attract new leads. But when you know what your audience cares about and needs, you can customize the infographic to expedite the customer in their journey toward finding your organization as their solution provider.
Step 4. Determine your budget for creation, promotion, and reporting
The new piece of content is a strategic investment that requires several areas of financing. First is the creation process must be financed from the idea phase, to development, to finalizing the graphic. Then, you’ll need to promote the new infographic on your marketing channels (organically or with paid ads) to help achieve the conversion goal(s) that you created in Step 2. Finally, it’s recommended that you track the results with proper reporting to confirm that you achieved a high return on your investment.
Each area will probably incur a cost, so evaluate your resources then follow your organization’s processes and policies to set a budget for the content creation project.
Step 5. Perform research to find data and statistics
This phase of the Planning Process is when you consolidate and organize the best data points for your infographic story telling. The data points could be statistics, survey results, process steps, educational information or comparison data that will be of interest to the audience based on their needs. Gather the information then begin to organize and prioritize the data points, plus include notes that will help the designer.
If you don’t have data points, some of the best research sources are company data and analytics, feedback from your customer service or sales team, public survey results, government databases, nonprofit data, trends, media sources, related infographics or use your own insights to create your data points and key takeaways.
Step 6. Plan a unique twist on how you present your information
Present your information in a unique way with a theme or fun concept. Provide the designer with creative ideas that would appeal to your target audience based on their common interests using captivating artwork, unique shapes, funny icons or emojis, or engaging characters. A best practice is to search Google and popular infographic sites (coolinfographics.com, Visual.ly, DailyInfographic.com, etc.) for at least three (3) examples or layouts that would match your project goals, then provide them to the designer in this planning step.
Step 7. Document your brand strategy
To assist your graphic designer, provide them with details on how this infographic should use your organization’s branding—policies for using your logo, name, colors, fonts and designs that define your company’s identity. By documenting the brand guidelines and rules to follow, you can eliminate design issues, which will save time and money on the project.
Step 8. Create the project plan with a schedule and resources list
As the final planning setup, create a project plan that contains a tentative schedule and a list of resources.
The schedule should set a start date, milestones for the creation process, a completion date for the design and revisions, and a launch date to publish and promote the infographic.
The resources list should include human resources needed as well as technical resources required and the budget.
II. INFOGRAPHIC CREATION PROCESS
For each moment that you invested in the Planning Process, you should see more than double that amount of time saved in the Creation Process! This is primarily because you’ve already provided answers to common questions, which will eliminate assumptions by the designer that could cause future revisions and design problems.
Now it’s time for the design phase, where your vision and research become a reality! Here are the recommend Creation Process steps:
Step 9. Gather and organize all the project assets.
The first role of the infographic designer—whether it’s yourself, a team member or outsourced—is to gather all of the notes, data points, research and other assets that were created in the planning phase. Organize the assets into a new project folder or according to your organization’s policies.
Step 10. Build a storyboard with the data points
The purpose of a storyboard is to breakdown the key points of the infographic’s story into manageable smaller projects, like scenes of a play. A graphic designer’s time is valuable so it’s recommended to first sketch the storyboard scenes of the data points, since concept changes can be made quickly and more inexpensive than in a digital format. On a simple budget, this can also be done with Post-It notes!
Once the sketched storyboard scenes are approved, convert the data points to a digital storyboard, typically created in Adobe Photoshop or Illustrator. If you don’t have the technical resources, the digital storyboard can also be designed using Microsoft PowerPoint, Canva.com or outsourced to a designer on a freelancer site like Fiverr.com.
Step 11. Create at least 3 design concepts
Based on the project’s goals and specifications, it’s recommended to develop at least three (3) design concepts. These concepts will all use the same data points but a different theme or layout to present the information.
For example, the “7 Benefits of Infographics” image at the top of this article had one simple concept with the data points in a table, one wild concept with the data points within bubbles, and the winning concept used abstract shapes for the data points.
Using your own set of criteria, select the top concept that meets the project and design requirements.
Step 12. Develop the first draft of the infographic
With your graphic design resources, implement all of the planning and conceptual work into the first draft of your infographic. Some tips are:
- Make the complex data an easy-to-understand data point.
- Confirm your data’s accuracy, timeliness, and original source(s).
- Proofread your data points and key takeaway text.
- Use whitespace (open space) to separate your data points for a better user experience.
- Add visual guidance, such as arrows, if it will help the reader navigate to the next data point.
- The header should be very eye-catching yet easy to read.
- The footer should contain all of your data sources in a font size that’s easy to read, plus add your logo.
Step 13. Gather feedback and make revisions
Since the first draft is rarely perfect, ask the key decision makers involved with the infographic for their feedback about the first version. A best practice is to consolidate all of the feedback into a batch of comments then provide them to the graphic designer to create a revision.
Typically, there is a feedback-revision loop that will continue for three or more revisions based on the length and complexity of the infographic. While the worst feedback is simply “I don’t like it”, the best feedback provides reasons such as comparisons to requirements or examples of better design ideas. The better the feedback that you provide the designer, the more efficient they will be making the revision once instead of multiple times.
When the designer completes a revision, they’ll send the new design back to the evaluation team. This process will continue until approval is achieved.
Step 14. Approve the final design and export it
Upon approval of the infographic design, the final step of the Creation Process is for the designer to export the image (Save As) in a format that’s best consumed and shared by the target audience. In most cases, this will be a PNG or JPG file format.
With the creation steps complete, the final set of steps is to get your new content marketing asset out to your target audience with a diverse promotion strategy.
III. INFOGRAPHIC PROMOTION STRATEGY
To maximize your investment in the creation of an infographic, it must be seen by members of your target audience. Therefore, you need a promotion strategy to share and publicize the benefits of the new digital marketing asset. Here are my recommended steps for a diverse promotion strategy to reach your target audience.
Step 15. Preparation for publishing the infographic
- Prepare a blog post or web page to host your infographic and create an SEO-friendly URL for that page.
-

Image A: snapshot Create a square snapshot of the infographic with the title or a key data point, since images with a 1:1 ratio will display better in most social media news feeds. Image A an example of a 1:1 ratio snapshot.
- Create “embed code” that will serve as instructions on how a reader can share your graphic on their website, which allows you to track when the image is loaded from your server. This HubSpot article has a great tutorial to create your embed code.
- Set a publishing date for the post or page to go live.
- Document the keywords and phrases related to the infographic that will be used in the promotion strategy.
- Document the hashtags that will be used in the promotion strategy.
- Write a short blurb (100-150 characters) about the infographic that can be used in short social media posts, like on Twitter.
- Write a long description (1-2 paragraphs) about the infographic that can be used in long-form social media posts and by the media.
- GO LIVE by publishing the infographic!

—Article continues after the SPECIAL OFFER—
Step 16. Promotion on OWNED marketing channels
Your “owned” marketing channels are the ones that you have ownership and control over, with no third-party restrictions such as algorithms or limiting factors. These typically include your website, blog, corporate email, email marketing system, and any mobile apps. Here are some promotion ideas.
- Promote the infographic with a banner or notice on your homepage linking to the new blog post or web page.
- Write an email blast to your subscribers announcing the infographic and its benefits.
- Write an email to employees to promote it internally and ask them to forward the email.
- Add a link to the infographic in your email signature.
- In future blog posts, find a way to refer to the infographic’s content and create an internal link to the infographic.
Step 17. Promotion on SOCIAL marketing channels
My recommendation is to post on your social networks the day that infographic is live, the day after it’s live at a different time and once per month if the infographic is “evergreen” with a long lifespan.
- Twitter: Post a short blurb with the image or square snapshot and link plus up to 3 hashtags.
- LinkedIn: Post a short blurb with the square snapshot and a link to the full image.
- Facebook: Post a long description and the square snapshot that includes a link to the infographic in the first paragraph.
- Instagram: Post a long description with the full image and include 10-20 hashtags related to the infographic at the end of the caption.
- Pinterest: Pin a short description with the full image and link on a board.
- Other social networks: Use the best practices to write a description, include the link, choose the square snapshot or full image, and include hashtags if appropriate with that audience.
Step 18. Promotion on PUBLIC / FREE channels
- Submit your infographic to directories like Visual.ly, Daily Infographic, Cool Infographics or these 100+ sites for infographics.
- Publish it on content curation sites like Scoop.It, Listly or a variety of other curation sites.
- Submit it on community sharing sites like Reddit, Quora and alternatives.
- Search for blog posts related to your infographic content then leave positive and value-adding comments on the post with a backlink to your infographic.
- Make a YouTube video of the infographic using a screen capture program then scroll from top to bottom, and optionally add a voiceover or captions.
Step 19. Promotion on PAID marketing channels
- Write a press release about the infographic and submit it to free and paid sites like PRWeb, PRFree, and PRLeap.
- Write a guest blog about the infographic and submit it to free and paid blogger sites in your field.
- Drive traffic to the infographic with a paid ad on Facebook, Instagram, LinkedIn or the best social network for your target audience.
Step 20. Promotion using RELATIONSHIP marketing
- Reach out to influencers on social media that have published content similar to your infographic content and ask them to share it.
- Reach out to bloggers that have published content similar to your infographic content and ask them to share it.
Step 21. Monitoring and analytics for ROI reporting
Since the infographic is an investment, you should have monitoring and reporting in place to track your success. Here are the key metrics that I recommend for your reporting.
- Page views of the blog post or web page that hosts the infographic
- Views of the image’s embed code URL in Google Analytics
- Social shares and likes across all your social networks
- Social comments by fans across all your social networks
- Conversion rate on the infographic’s optional call-to-action, such as a landing page’s page views or email signups
- Mentions of the infographic by influencers
- Backlinks to the infographic host page
RELATED RESOURCES
- 12 Tools to Create Infographics (by Buffer)
- 27 Creative Ways to Market Your Infographic
- Infographic Link Building: 9 Ways to Funnel Link Juice to your Infographic
CONCLUSION
There are three phases to making an infographic that reaches your target audience and effectively helps you achieve your marketing goals.
The first phase is the Infographic Planning Process, which consists of 8 steps to document your target audience, marketing goals, audience’s needs, budget, data points, a unique twist, brand strategy and project plan.
The second phase is the Infographic Creation Process, which consists of 6 steps to gather the project assets, build a storyboard, create 3 design concepts, develop the first draft, get feedback and make revisions and then approve the final design.
The third phase is the Infographic Promotion Strategy, which consists of 7 steps to prepare for publishing then promote on your owned, social, free and paid marketing channels, in addition to relationship marketing. The final step is to implement your monitoring and reporting to track the success of your marketing investment.
In the Comments section below, let us know your feedback about our 21 steps for infographics. Which one is most helpful or what would you add?